Note
Go to the end to download the full example code.
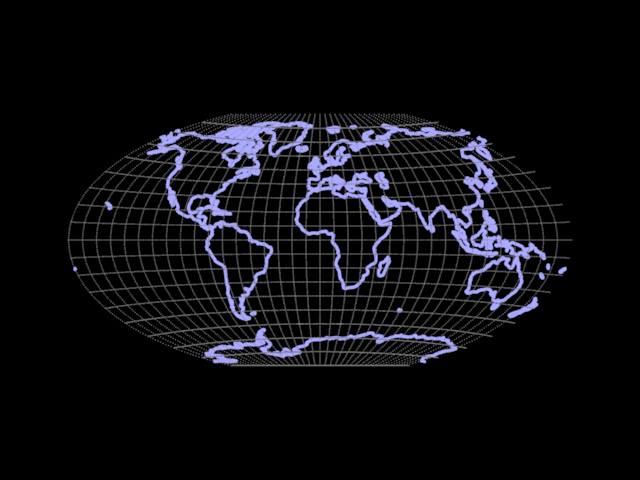
World map projection
Example showing a world map using a common map projection.
This uses WorldObject.nonlinear_transform to convert lon/lat coordinates
to a rectangular map. Code is shown for both the “Mercator” and the
“Winkel Tripel” projections.
Note
To run this example, you need a model from the source repo’s example folder. If you are running this example from a local copy of the code (dev install) no further actions are needed. Otherwise, you may have to replace the path below to point to the location of the model.
import numpy as np
from rendercanvas.auto import RenderCanvas, loop
import pygfx as gfx


# Load public domain coastline data from naturalearthdata.com.
# Original source: https://naturalearth.s3.amazonaws.com/110m_physical/ne_110m_coastline.zip
# Transformed to a numpy array using geopandas and then stored as npz
lonlat = np.load(model_dir / "coastlines.npz")["lonlat"]


WGSL_MERCATOR = """
fn nonlinear_transform(pos: vec3f) -> vec3f {
    // Source: Wikipedia - this is web-mercator
    let lon = pos.x * PI / 180;
    let lat = pos.y * PI / 180;
    let max_lat: f32 = 1.4844222;  // = 2*atan(e**pi)-pi/2 ≈ 85°
    let clamped_lat = clamp(lat, -max_lat, max_lat);
    let y = log(tan(0.25 * PI + 0.5 * clamped_lat));
    return vec3f(lon, y, pos.z);
}
"""

WGSL_WINKEL_TRIPEL = """
fn nonlinear_transform(pos: vec3f) -> vec3f {
    // Source: Wikipedia
    let lon = pos.x * PI / 180;
    let lat = pos.y * PI / 180;
    let x1 = lon * cos(lat / 2.0);
    let y1 = lat;
    let alpha = acos(cos(lat) * cos(lon / 2.0));
    let sinc = select(1.0, sin(alpha) / alpha, alpha > 1e-6);
    let x2 = 2.0 * cos(lat) * sin(lon / 2.0) / sinc;
    let y2 = sin(lat) / sinc;
    let x = 0.5 * (x1 + x2);
    let y = 0.5 * (y1 + y2);
    return vec3f(x, y, pos.z);
}
"""

# Setup visuzaliation

canvas = RenderCanvas(update_mode="continuous")
renderer = gfx.WgpuRenderer(canvas)
scene = gfx.Scene()
scene.add(gfx.Background.from_color("#000"))

camera = gfx.OrthographicCamera(maintain_aspect=True)
camera.show_object((0, 0, 0, 3), up=(0, 0, 1))
controller = gfx.PanZoomController(camera, register_events=renderer)


# Add points for the lon/lat lines

density = 1

point_positions1 = []
for lat in range(-90, 90, 10):
    x = np.linspace(-180, 180, 360 * density, dtype=np.float32)
    y = np.full_like(x, lat)
    point_positions1.append(np.column_stack([x, y, np.zeros_like(x)]))
for lon in range(-180, 180, 10):
    y = np.linspace(-90, 90, 180 * density, dtype=np.float32)
    x = np.full_like(y, lon)
    point_positions1.append(np.column_stack([x, y, np.zeros_like(x)]))
point_positions1 = np.vstack(point_positions1)

points1 = gfx.Points(
    gfx.Geometry(positions=point_positions1),
    gfx.PointsMaterial(size=1.0, color="#777"),
)
scene.add(points1)


# Add lines for the coastlines

lon = lonlat[:, 0]
lat = lonlat[:, 1]
point_positions2 = np.column_stack([lon, lat, np.zeros_like(lon)])
lines2 = gfx.Line(
    gfx.Geometry(positions=point_positions2),
    gfx.LineMaterial(thickness=3.0, color="#aaf"),
)
scene.add(lines2)


# Apply projection (pick one)

for ob in [points1, lines2]:
    ob.nonlinear_transform = WGSL_WINKEL_TRIPEL
    # ob.nonlinear_transform = WGSL_MERCATOR


def animate():
    renderer.render(scene, camera)


if __name__ == "__main__":
    canvas.request_draw(animate)
    loop.run()
Total running time of the script: (0 minutes 0.437 seconds)